DUSTrack GUI
Four-panel architecture (figure from the paper)
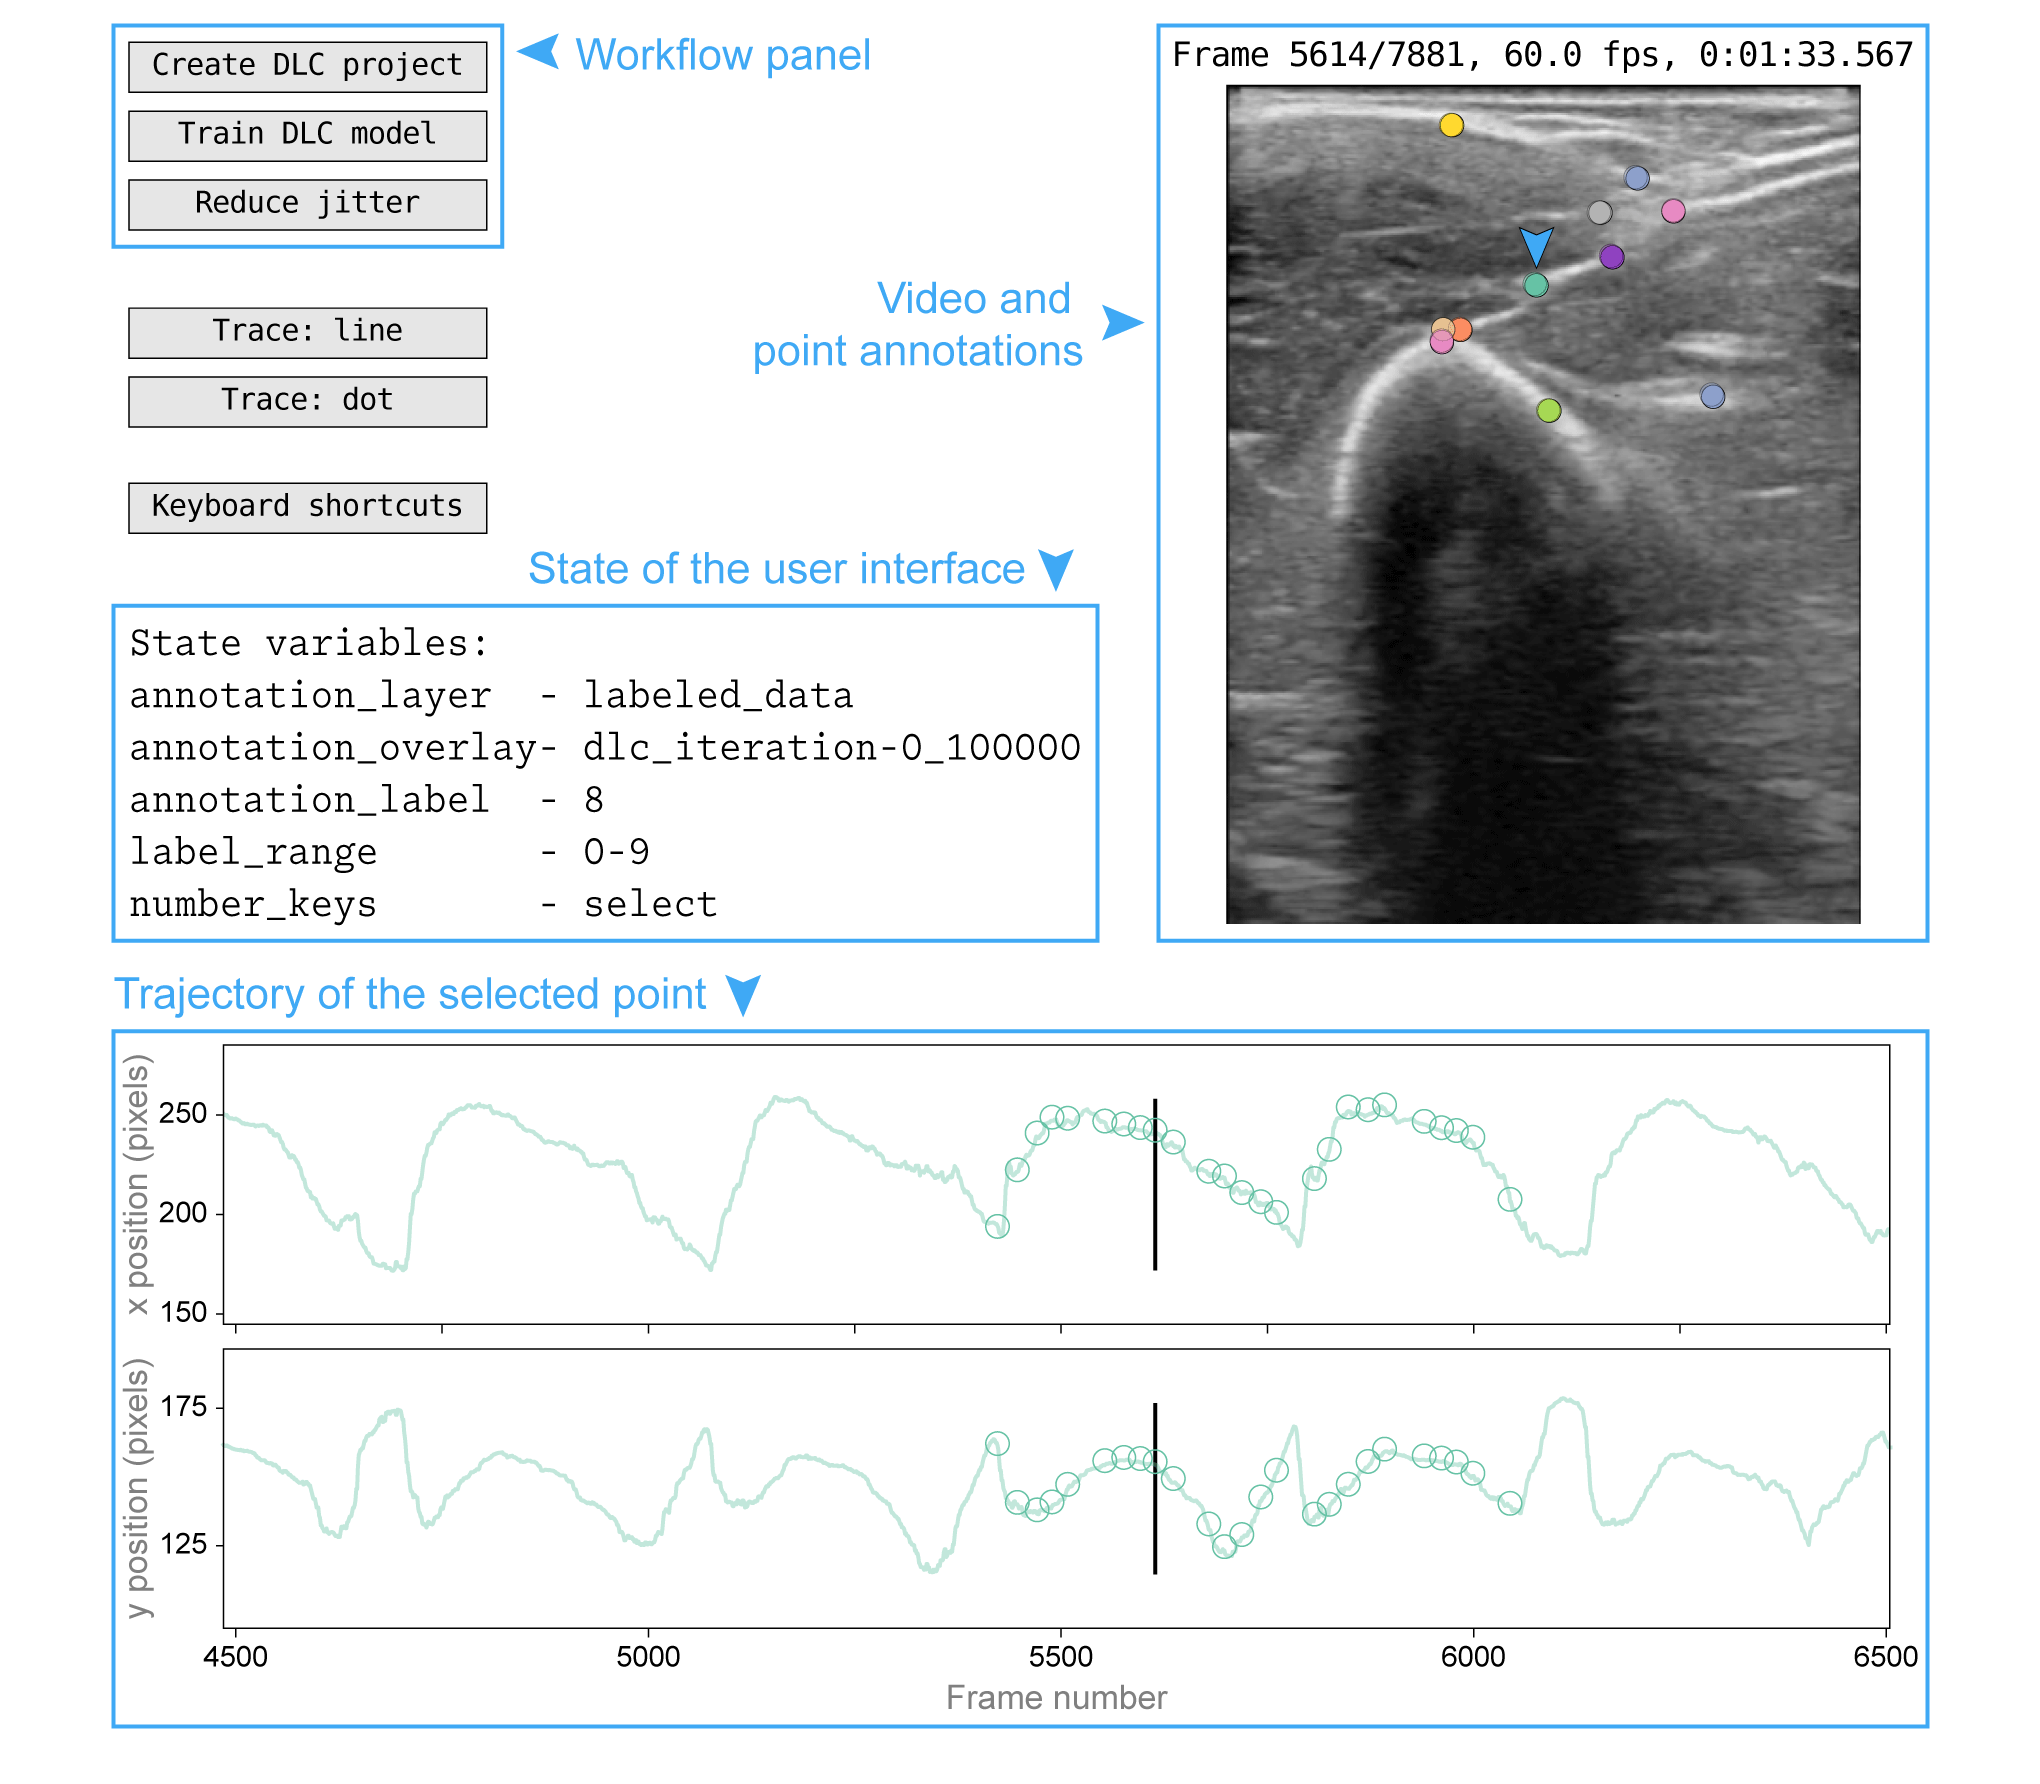
DUSTrack’s graphical user interface, as published in the paper.
The interface has four panels: the workflow panel (top left)
provides controls for creating DLC projects, training models, and
applying jitter-reduction post-processing; the video and point
annotations panel (right) shows the ultrasound video frame with
current point annotations (the selected point is marked with an
arrow); the interface state panel (middle left) displays active
variables, including the current annotation layer and selected point;
and the trajectory of the selected point panel (bottom) shows the
x and y coordinates over time. The interface can display two
annotation “layers” simultaneously — in this example, the
labeled_data layer appears as open circles in the trajectory plot,
while the dlc_iteration-0_100000 layer appears as a translucent
continuous trace. Blue text, arrows, and boxes have been added to
highlight the interface features and are not part of the actual
interface.
Current GUI (1.1.0)
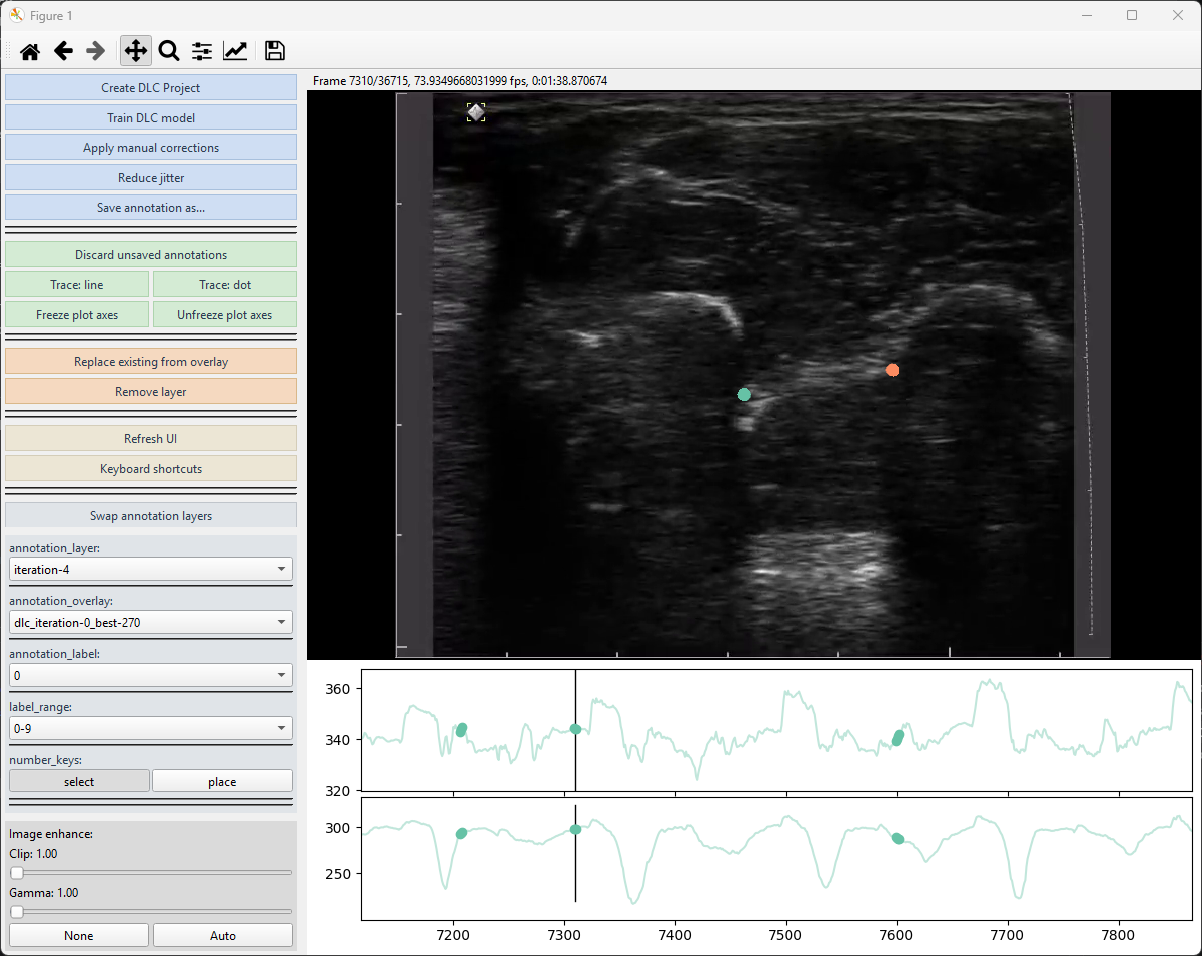
The four-panel architecture above is unchanged in current releases, but the contents within each panel have evolved since the paper. Specifically:
Workflow panel: now organized into four task-flow groups separated by horizontal lines, with a pastel per-group palette (powder blue → mint → apricot → silver):
Workflow: Create DLC project · Train DLC model · Apply manual corrections · Reduce jitter · Save annotation as…
Display: Trace: line / Trace: dot · Freeze/Unfreeze plot axes · Refresh UI · Keyboard shortcuts — and an EnhanceWidget with two sliders (CLAHE clip, Gamma) plus a
None | Autobutton row that replaces the old “Toggle enhance” single-button affordance.Niche (layer-mutating affordances): Decimate annotations · Discard unsaved annotations · Replace existing from overlay · Remove layer.
Swap layers (foreground ↔ overlay, positioned directly above the statevars widget it manipulates).
Interface state panel: promoted from a static text overlay to an interactive Qt widget. Each state variable is now its own row with a control matched to the variable’s type — dropdowns for
annotation_layer/annotation_overlay, toggle buttons fornumber_keys, and so on. Long values (e.g.dlc_iteration-3_250000) no longer elide.Video panel: visually unchanged, but the rendering backend swapped to a Qt-native
QGraphicsView+QPixmapItem(fast_render=True, on by default). Wheel-zoom and middle-button pan/reset land on the image pane; the trajectory pane below continues to render through matplotlib for now (Qt-native traces ship in 1.2.0).Trajectory panel: unchanged in look. Press
rwhile hovering over a trajectory plot to reset the time axis to the full video range and autoscale y to the visible data; pressalt+rto reset both axes to the data extent. While hovering over the image pane,rinstead resets the image zoom/pan.
For a complete list of keyboard shortcuts and mouse controls, see GUI Keyboard Shortcuts — or open the Keyboard shortcuts button in the Display group to display the same cheatsheet live, grouped by section (Annotation / Frame navigation / Layer-label / LK-interpolate / View / File / Other).